
Definite integral
The definite integral is used to measure the area of shapes that are described by a function.
Motivation
Let’s take the function
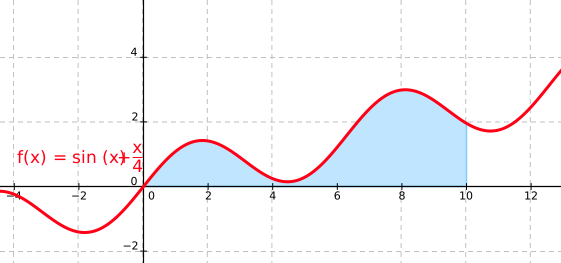
We are interested in the area highlighted in blue. How could we find it? We can split the whole blue area into several smaller areas, work out the area of each smaller piece and add all these partial areas together. To work out the area of a smaller piece with a formula, it must have a sensible shape. A rectangle is an obvious choice.
First we choose an increasing sequence of points x0 to xn such that x0 = a, xn = b. The larger n is, the more accurate our result will be. We choose the simple sequence x0 = 0, x1 = 1, x2 = 2, …, x10 = 10. From neighbouring points we form the intervals [xi − 1, xi], so we get the set of intervals
We call the first interval D1, the second D2 and so on. Next we find the minimum value of the function f in each interval Di. For example, in D1 the function f has its minimum value at x = 0, and f(0) = 0. In D2 the lowest value is at x = 1 and
Now we draw rectangles on the graph. The ith rectangle has width xi − xi − 1 and height mi:
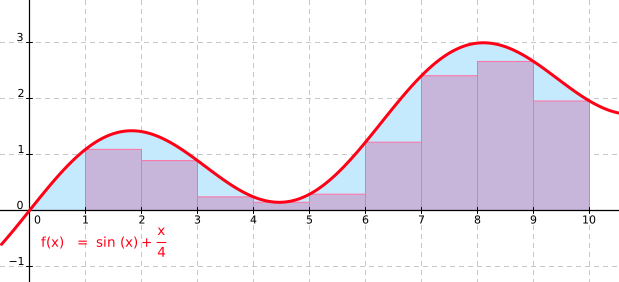
We can see that each interval has one rectangle that lies entirely under the curve but is as tall as possible. The height of each rectangle in the ith interval is exactly mi. If we now added up the areas of these rectangles, we would get an estimate of the area under the curve. The more rectangles we draw under the curve, the more accurate our estimate. We would work out the area of the ith rectangle as si = mi · (xi − xi − 1), so the sum of all the rectangles would be:
We can also go the other way: instead of taking the minimum value on the interval Di, we take the greatest value. We label these values Mi. The rectangles would then look like this:
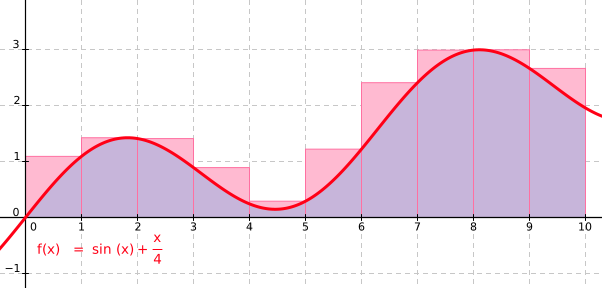
Again each interval has one rectangle, and it always has height Mi. The top edge of a rectangle touches the curve only at the local maxima of its interval. Adding up the areas of the individual rectangles gives us another estimate of the area under the curve. We would work out this area as
Again, if we increase the number of rectangles, we get a more accurate estimate.
We now introduce the lower and upper sums. We say that s(D, f) is the lower sum and its value is
where f is a continuous function on the interval [a, b], x0 = a, xn = b, D is a partition of the interval [a, b] into smaller intervals and n is the number of these intervals. We denote the upper sum by S(D, f) and it is equal to:
where f is a function and D is a partition of the interval [a, b] into n intervals.
Put simply, the finer the partition D, the closer the values of s(D, f) and S(D, f) get, until in the limit they are equal. So there is exactly one real number A such that
for every possible partition D. What is A? The number A is exactly the area under the curve, because it is the only value that is greater than or equal to the total area of the rectangles under the curve and at the same time less than or equal to the total area of the rectangles “above the curve”.
Definition of the definite integral
From the previous section we know that for a continuous function f on the interval [a, b] we have s(D, f) ≤ A ≤ S(D, f) for every partition D. This number A is called the definite integral of the function f from a to b. We write
The fundamental theorem of calculus tells us that the following holds:
where F is an antiderivative of the function f. The right-hand side is sometimes also written like this:
The geometric meaning of the definite integral is then the area under the curve of a non-negative function f, as we have already seen. We started with the function
First we integrate the function f:
So the antiderivative F has the form
The approximate area under the curve on the interval [0, 10] is 14.339.
Chapters: Integral, Integration by parts, Integration by substitution, Definite integral
