
Graphical representation of complex numbers
We can also plot complex numbers on the usual Cartesian coordinate axes. The plane where we plot complex numbers is called the complex plane or the Argand diagram.
Plotting on the Argand diagram
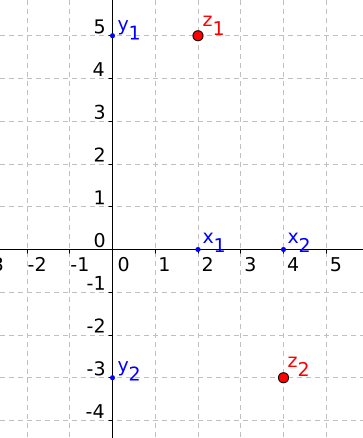
Every complex number z = x + yi is plotted in the plane as the point with coordinates (x, y). On the Argand diagram the x-axis is called the real axis and the y-axis is called the imaginary axis. So let’s take two complex numbers, z1 = 2 + 5i and z2 = 4 − 3i. On the Argand diagram we would plot them like this:
The negative and the complex conjugate
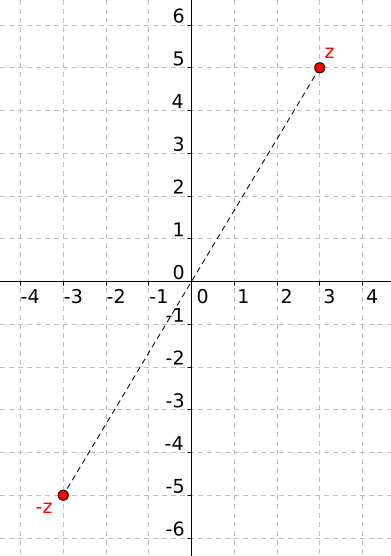
On the Argand diagram we can easily plot the negative and the complex conjugate of a number. Take the complex number z = 3 + 5i. Its negative, which is −3 − 5i, is symmetrical to z about the origin of the Argand diagram:
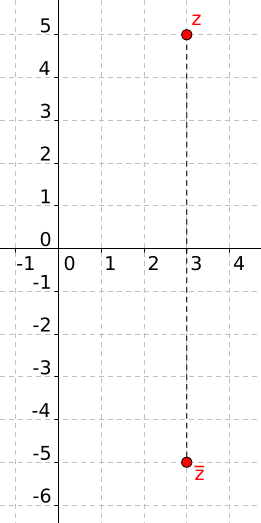
For the complex conjugate, the sign of the imaginary part changes, so the complex conjugate is a reflection of the original number in the real axis (the x-axis). See the figure (
Modulus
For real numbers, the absolute value is the positive version of a given number. For complex numbers we work out the modulus in a slightly more involved way. The modulus of a complex number is the distance of its point on the Argand diagram from the origin.
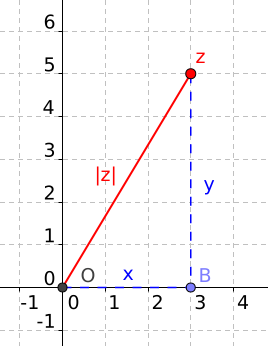
We can work out the distance from the origin using Pythagoras’ theorem, which tells us that |z|2 = x2 + y2, where x and y are the real and imaginary parts of the complex number. We then get the modulus of z = x + yi simply by taking the square root:
Chapters: Complex numbers, Graphical representation of complex numbers, Modulus–argument form of a complex number
