
The graph of a function
The graph of a function of one parameter is a curve that describes how the function behaves.
What the graph of a function is
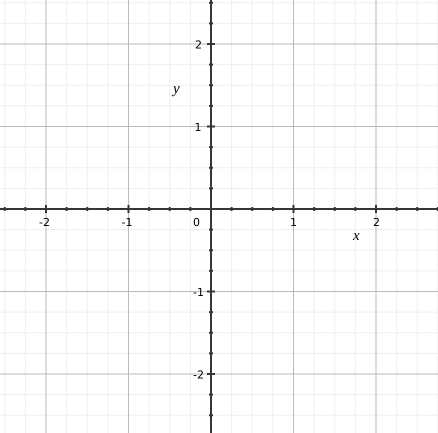
The graph of a function f is a curve that describes the behaviour of f. It is a curve that follows the values of the function f. To draw the graph of a function of one variable, we need a plane and two axes – the x-axis and the y-axis. You surely know these; they are the two perpendicular lines. It looks like this:
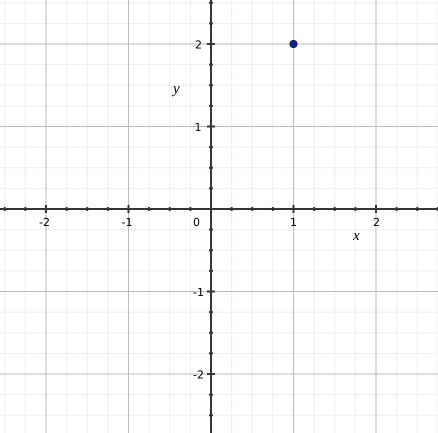
We draw the graph of a function f by taking a point x from the domain of the function and working out the value f(x). This gives us the pair (x, f(x)). This pair gives the coordinates of a point on the graph. We mark the first coordinate (that is, x) on the x-axis and the second coordinate (that is, f(x)) on the y-axis. If we have the function f(x) = x + 1 and choose one for x, we get the pair (1, 2). We plot it on the graph like this:
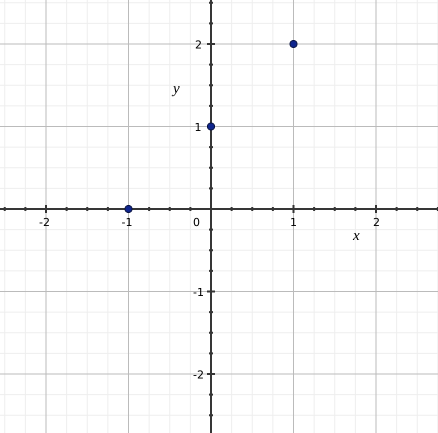
Next we add the points (0, 1) and (−1, 0). We get a picture like this:
If we worked out, one after another, all the points from the domain of the function, we would get a single continuous line that would look like this:
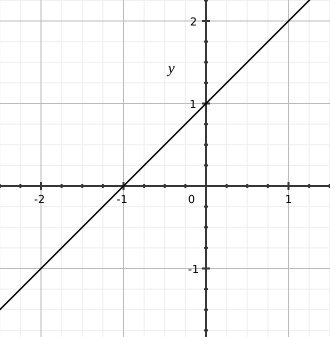
This line is the graph of the function f(x) = x + 1. From this graph we can also work backwards and read off the values of the function. If you want to find the value of the function at x = −2, find the value −2 on the x-axis, then look at the curve and see what y-coordinate the point with x-coordinate −2 has.
Chapters: What is a function, Functions of several arguments, Composition of functions, The graph of a function
