
✖

Reciprocal functions

A linear fractional function is a function that has a linear function in both the numerator and the denominator:

y=ax+bcx+d

The very simplest linear fractional function is the reciprocal function y=kx. You may know it from GCSE as inverse proportion. From Liverpool to Warrington is roughly 30 kilometres. If you travel at 30 km/h, you will be there in an hour, at 60 km/h in half an hour, and on a bike at 15 km/h you will arrive in two hours. Twice the speed, half the time. The journey time in hours is therefore

t=30v,

where v is the speed in kilometres per hour. And that is exactly the function y=kx with k = 30.

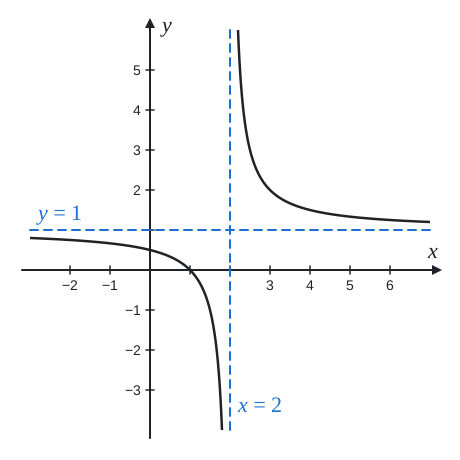
The graph of a linear fractional function is a hyperbola, and a rectangular one at that, meaning its asymptotes are perpendicular to each other. Compared with the pictures in that article, it is also turned so that it does not approach two crossing slanted lines, but a horizontal and a vertical one. This is what the graph of, for example, y=x−1x−2 looks like; the asymptotes are the blue dashed lines x = 2 and y = 1:
Graph of y=\frac{x-1}{x-2} with asymptotes x=2 and y=1

The formula comes with two more conditions, c ≠ 0 and ad − bc ≠ 0. If c = 0, there would be no x in the denominator and we would get an ordinary linear function. If ad − bc = 0, the numerator is a multiple of the denominator, the fraction cancels down and a constant function is left.

The function k over x

We start with the function y=kx. We must not substitute zero for x, because we cannot divide by zero, so the domain is all real numbers except 0. But we never get zero as an output either: a fraction with a non-zero numerator cannot be zero. So the range is also all real numbers except 0.

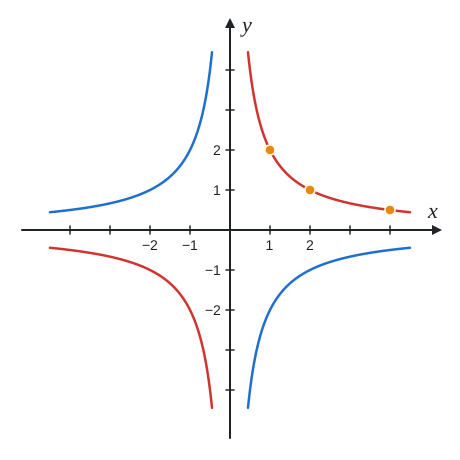
Let’s try a few numbers in the function y=2x. For x = 1 we get y = 2, for x = 2 we get y = 1 and for x = 4 only y=12. The larger x is, the more tightly the graph hugs the x-axis without ever touching it. Conversely, the closer x is to zero, the larger y becomes: for x=110 we get y = 20. So the graph shoots upwards along the y-axis. For negative x it is the same, only with the opposite sign.
Graph of the function y=\frac{2}{x} (red) and y=-\frac{2}{x} (blue)

The red curve in the picture belongs to the function y=2x, the blue one to y=−2x. The orange points correspond to the values we have just calculated. The position of the branches is decided by the sign of k:

  • for k>0 the branches of the hyperbola lie in the first and third quadrants,
  • for k<0 they lie in the second and fourth quadrants.

The x-axis and y-axis, which the graph approaches, are called asymptotes.

Now watch out for a trap that nearly everyone falls into. The function y=2x is decreasing, isn’t it? Each red branch on its own really does go down. But let’s try x1 = −1 and x2 = 1. We have x1<x2, and yet f(−1) = −2 is less than f(1) = 2. So the function is not decreasing on the whole domain; it is decreasing separately on the interval (−∞, 0) and separately on the interval (0, ∞). Anyone who writes that it is decreasing on ℝ ∖ {0} has made a mistake.

A shifted graph and converting the general form

The graph of y=kx can be shifted in the same way as the parabola for a quadratic function. The function

y=kx−m+n

has the same graph as y=kx, just shifted m to the right and n upwards. Watch the sign: the denominator contains x − m, so kx−3 is shifted three to the right, not to the left. The asymptotes shift along with the graph, so they are no longer the axes but the lines x = m and y = n. The vertical asymptote lies where the denominator is zero. When x approaches the number m, the denominator is tiny and the fraction enormous, so the graph shoots up or down. The horizontal asymptote lies where the function values head when x is very far from zero, on the positive and the negative side alike. The fraction kx−m is then almost zero and only n remains.

The general formula y=ax+bcx+d, however, usually does not come in this form. Let’s see how to convert the function

y=2x+1x−1.

The denominator contains x − 1, so we will try to produce the same expression in the numerator too. Twice x − 1 is 2x − 2, and to get the numerator 2x + 1 from that we need to add three more:

2x+1=2⋅(x−1)+3

We substitute into the fraction:

y=2⋅(x−1)+3x−1

We split the fraction into a sum of two:

y=2⋅(x−1)x−1+3x−1

In the first fraction we cancel x − 1:

y=2+3x−1

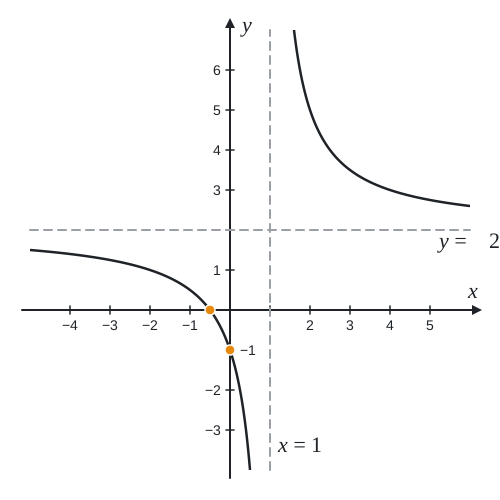
You can reach the same result by algebraic division: (2x+1)÷(x−1) gives 2 with remainder 3. From the result we can easily read off m = 1, n = 2 and k = 3. The asymptotes are the lines x = 1 and y = 2. Since k is positive, the branches lie, relative to the asymptotes, at the top right and the bottom left, just as for y=2x.

We find the domain from the denominator, which must not be zero, so x ≠ 1. The function never takes the value 2, because the fraction 3x−1 cannot be zero:

domain=R∖{1},range=R∖{2}

That leaves the intercepts with the axes. At the x-intercept y = 0, and a fraction is zero only when its numerator is zero:

2x+1=0/−12x=−1/÷2x=−12

We find the y-intercept by substituting zero for x:

y=2⋅0+10−1=1−1=−1

The graph crosses the x-axis at the point (−12,0) and the y-axis at the point (0, −1). Both intercepts are shown in orange in the picture, and the asymptotes as grey dashed lines:
Graph of the function y=\frac{2x+1}{x-1} with asymptotes x=1 and y=2

Notice that the y-intercept also came out of the rewritten form: 2+30−1=2−3=−1. It checks out.