
Graphs of trigonometric functions
Graphs of trigonometric functions turn up often and quite naturally in nature. Here we show what their basic shape is and how they change depending on the input.
Graph of the sine function
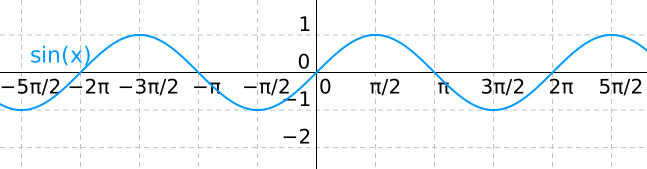
The basic graph of the sine function looks like this:
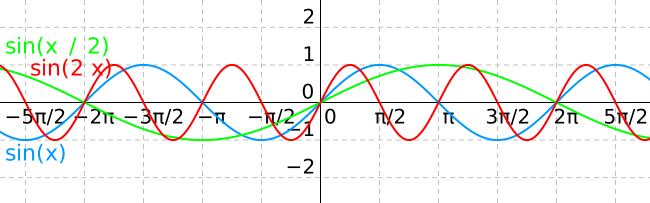
What happens if we change the input of the sine function? For example, if instead of a plain x we put in 2x? The answer is that the period of the curve gets smaller, so it “oscillates” faster. On the other hand, if the input is the expression x/2, the curve is stretched out and the period gets bigger. The following figure shows this clearly, and the ordinary function sin(x) is kept in it for comparison.
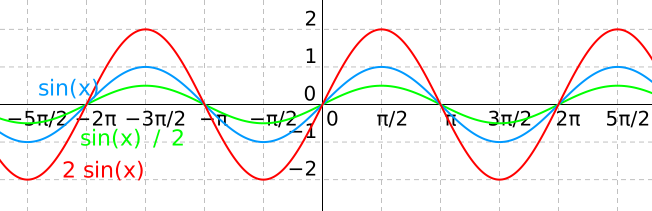
If instead you double the whole value of sine, the curve is simply twice as high, or twice as low, at every point. The same goes if you divide the result by two. Again, here is a figure to make it clear:
Graph of the cosine function
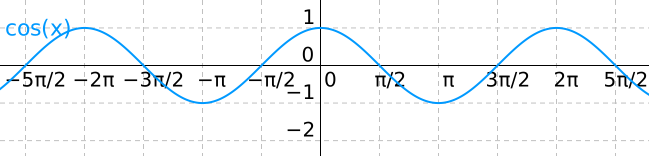
The basic graph of the cosine function looks like this:
When the input of the function changes, the graph of cosine changes in a similar way to the graph of sine.
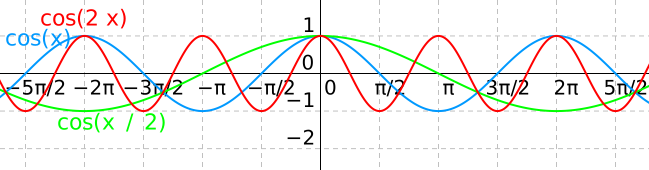
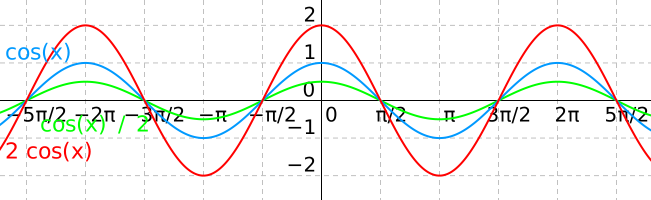
The graph changes in exactly the same way if you multiply or divide the result by two:
Graph of the tangent function
The basic graph of the tangent function looks like this:
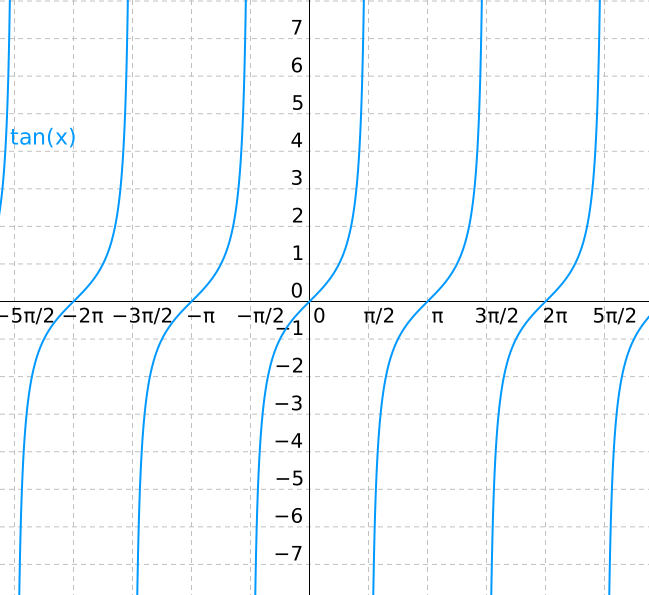
If we change the input of the function to 2x, the period gets smaller and the graph is narrower. On the other hand, if we change the input to x/2, the graph is wider.
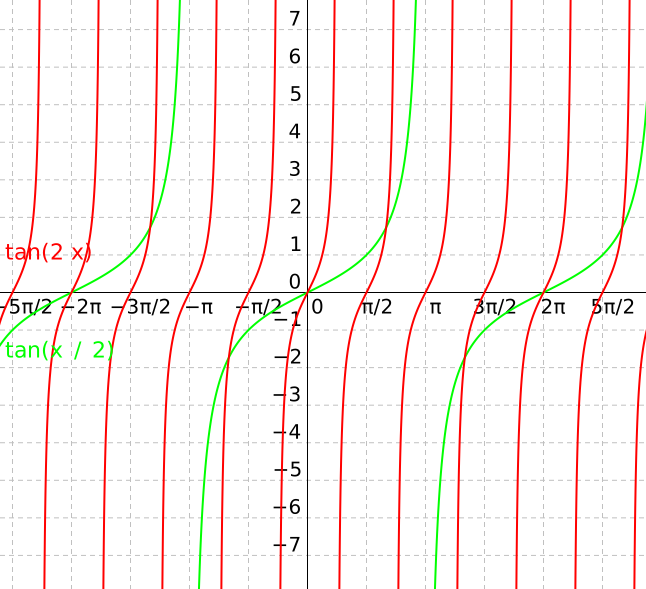
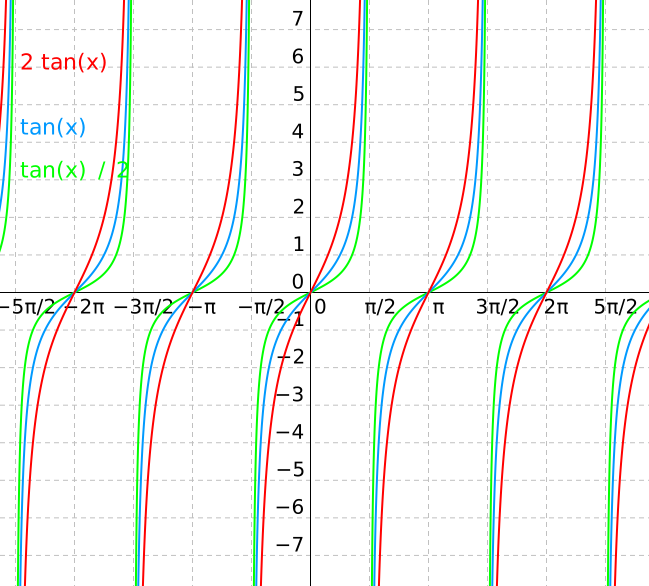
If we multiply the result by two, the graph is “straighter”; if we divide it by two, the graph is more rounded.
Chapters: Trigonometric functions, The unit circle, Inverse trigonometric functions, Properties of sine, cosine, tangent and cotangent, Trigonometric formulae, Graphs of trigonometric functions, Sine rule and cosine rule
