
Motion problems
At eight in the morning a car leaves London along the M1 at 90 km/h. At the same moment a second car sets off towards it from Nottingham at 115 km/h. The route along the motorway between the two cities is 205 km long. When and where do the cars meet?
Motion problems always look different, but almost all of them can be cracked with the same trick. For each vehicle we write down where it is at time t, and then look for the moment when both are in the same place. Everything moves at a constant speed, so the formulas for uniform motion in a straight line and the usual method for solving problems are all we need.
Two cars heading towards each other
We write down what we know and what we are looking for. The car from London gets index 1 and the car from Nottingham index 2:
Everything is in kilometres and hours, so the units are not mixed and we do not need to convert anything. The time will come out in hours.
A sketch helps. We stretch the x-axis along the motorway and put the origin in London, so Nottingham lies at 205 km.
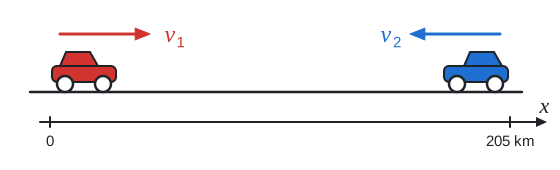
The red car travels in the direction of the axis, so its position is simply the distance it has covered:
The blue car starts at 205 km and travels against the direction of the axis. Its position therefore decreases by 115 km every hour:
The minus sign is there for the same reason that Oscar’s graph went down on his way home. A physicist would happily say that the blue car has a velocity of −115 km/h. We keep the speed positive, as the speedometer shows it, and put the direction into the formula as a sign.
The cars meet when they are in the same place, that is when x1 = x2. We solve the problem in general:
The second line makes sense even without equations. The expression v1 · t is the distance travelled by the red car, v2 · t is the distance travelled by the blue car, and together they cover the whole distance between the cities. Every hour the cars get closer by 90 km + 115 km = 205 km. Substituting:
The units work out: kilometres divided by kilometres per hour give hours. We get the place where they meet by substituting the time into the position of either car:
Check: at that moment the blue car is at 205 km − 115 km = 90 km, which is the same place. The estimate agrees too. If both cars travelled at the same speed, they would meet halfway. The car from Nottingham is faster, so they meet closer to London. Answer: the cars meet at 9 am, 90 km from London. The drivers will hardly have time to wave, as they are rushing towards each other at 205 km per hour.
Intersection of graphs
We can solve the same problem without an equation. We draw the positions of both cars in one graph, just like the car and the lorry earlier.
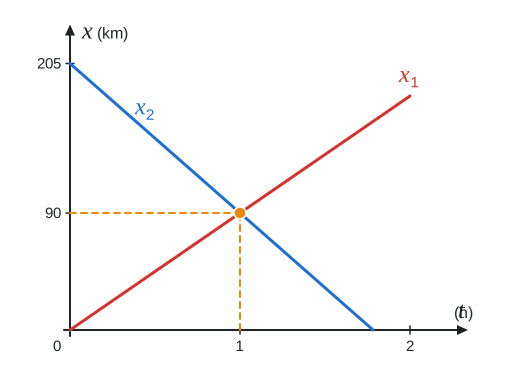
The red line starts at the origin and rises with a slope of 90 km/h. The blue line starts at a height of 205 km and falls, because the car travels against the direction of the axis. It falls more steeply than the red one rises, because the car from Nottingham is faster. It reaches London, where the position is zero, in a little under two hours.
Where the lines cross, both cars have the same position at the same time. That is exactly the meeting. From the orange intersection we go down to the time axis and read 1 h, and left to the vertical axis and read 90 km.
Solving the equation x1 = x2 is the same as looking for the intersection of two lines, except that we calculate instead of drawing. The graph shows what is happening in the problem and gives a quick estimate. The equation gives an exact number even when the intersection falls between the gridlines.
Catching up
A cyclist sets off from Luton at a constant speed of 18 km/h. An hour later a car follows along the same road at 54 km/h. When and where does it catch up with the cyclist?
Let’s decide where to measure the time from. The most convenient choice is to start the stopwatch when the car sets off. By then the cyclist has been riding for an hour, which gives a head start of 18 km. This is his initial distance s0 in the formula s = s0 + v · t. The cyclist only moves forwards and set off from the origin of the axis, so his initial distance coincides with his initial position. We run the axis along the road with the origin in Luton. The cyclist gets index 1 and the car index 2:
Both move in the direction of the axis, so their positions are
The car catches up with the cyclist when they are in the same place, x2 = x1:
This time the denominator contains the difference of the speeds. Every hour the car cuts 54 km − 18 km = 36 km off the head start, just as the lead of the car over the lorry grew by the difference of their speeds earlier. We calculate:
The car catches up with the cyclist in half an hour, that is in 30 min. We read off the place of the meeting from the position of the car:
At the same moment the cyclist is at 18 km + 18 km/h · 0.5 h = 27 km, so it matches. Answer: the car catches up with the cyclist half an hour after setting off, 27 km from Luton.
Here too we draw a position graph. This time the time axis shows minutes since the car set off, so that no decimal numbers appear in the picture.
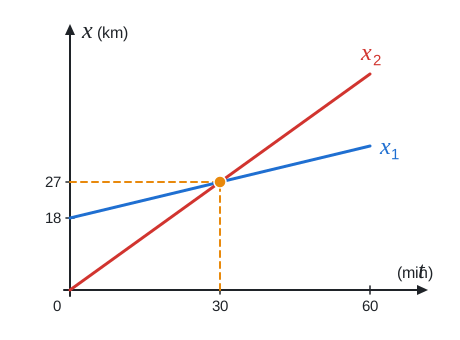
The cyclist’s blue line does not start at the origin but at a height of 18 km, just like the graph of the car that passed the marker post. The car’s red line starts at zero and is steeper. The vertical gap between the lines is the cyclist’s head start. It shrinks every minute until it disappears completely at the intersection, at 30 min and 27 km. Beyond the intersection the red line lies above the blue one: the car has overtaken the cyclist and is moving away.
Be careful about what we are answering. We measure the half hour from the moment the car set off. By then the cyclist has already been pedalling for an hour and a half. Had we started the stopwatch with him, the answer would have been an hour and a half. Both are true, each time is just measured from a different moment, so we must say which one we mean in the answer.
The formula tells us one more thing. If the car travelled at only 18 km/h, the denominator would be zero. You cannot divide by zero, and the car would never catch up with the cyclist, not even in Northampton.
A train in a tunnel
A train 200 m long passes at a constant speed of 72 km/h through a tunnel that is 1 km long. How long does it take to pass through the tunnel completely, that is from the locomotive entering to the last carriage leaving?
It is tempting to divide the length of the tunnel by the speed. But here we must not treat the train as a point particle, because its length is exactly what decides the result, and without a sketch it is easy to overlook.
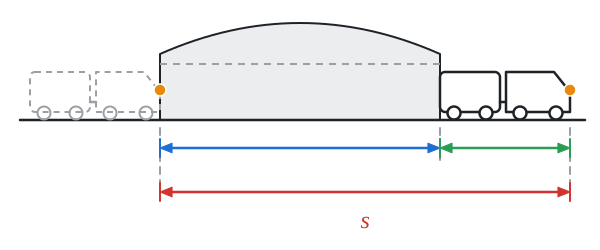
It is enough to follow a single point of the train, the front of the locomotive (orange). At the start it is at the entrance to the tunnel. When the last carriage leaves the tunnel, the front is beyond the exit by the whole length of the train. So it has travelled the length of the tunnel (blue) plus the length of the train (green):
The lengths are in metres, so we convert the speed to metres per second:
Time is distance divided by speed:
Metres divided by metres per second give seconds, so the train passes through the tunnel in a minute. Anyone who used only the length of the tunnel got 50 s. But at that moment the locomotive is only just coming out, and the whole train behind it is still in the tunnel. The estimate agrees: the train covers a kilometre in fifty seconds and the extra two hundred metres in another ten.
Now work out for yourself how long the whole train is inside the tunnel. It starts when the last carriage enters the tunnel, so the front is 200 m past the entrance. It ends when the front reaches the exit. The front travels 1,000 m − 200 m = 800 m, which takes 40 s. This time the length of the train is subtracted.
Downstream and upstream
A pleasure boat sails on the Thames. Relative to the water it travels at 15 km/h and the river flows at 3 km/h. How long does it take to reach a pier 36 km downstream, and how long to come back?
The boat’s speed is measured relative to the water. If the skipper switched off the engine, the water would carry the boat along at 3 km/h. As always, it matters what we measure the motion relative to. Relative to the bank, the boat going downstream covers 15 km an hour under its own power, and the water moves it a further 3 km. The boat gets index 1 and the current index 2. We denote the time downstream
Downstream the speeds add up and the journey takes
Upstream the water pulls the boat back by 3 km every hour and the speeds are subtracted:
Kilometres divided by kilometres per hour give hours. The boat reaches the pier in two hours and comes back in three.
If the current reached the boat’s speed relative to the water, the denominator of the second formula would be zero, just like for the car that followed the cyclist at only 18 km/h. Going upstream the boat would stand still relative to the bank, and the skipper could leave the engine running all day without the starting pier getting a metre closer.
And now a trick question. What was the boat’s average speed over the whole journey there and back? Anyone who says 15 km/h, because the current helped once and hindered once by the same amount, has fallen for it just like in the problem out at 60, back at 40. The boat covered 72 km in 5 h:
It spent longer going upstream, three hours instead of two, so the average leaned towards the slower speed. In still water it would cover the same 72 km in 4.8 h, that is 4 h and 48 min. A current that helps and hinders equally always makes the round trip longer.
In all the problems in this article the cars, trains and boats travelled at a constant speed. A real car, however, first has to get going and then brake before the finish. How to describe motion in which the speed changes is the subject of the next article, Acceleration.
