
Uniformly accelerated motion
A tram stands at a stop, the doors close and the tram pulls away with an acceleration of 1 m/s2. Every second it travels 1 m/s faster: 1 m/s after the first second, 2 m/s after the second, 10 m/s after the tenth. Motion along a straight line in which the acceleration stays constant is called uniformly accelerated motion in a straight line. It is called uniform because the velocity increases uniformly, by the same amount every second. No tram or car has perfectly constant acceleration, but pulling away at a green light or a stone dropped from the hand come very close.
Velocity at any moment
How fast is the tram travelling after seven seconds? You probably answer 7 m/s, and you are right. We derive the general formula from the formula for acceleration
The velocity at time t is therefore
Every second a is added to the original velocity, so in t seconds a · t is added. The tram starts from rest, v0 = 0 m/s, and after ten seconds it is travelling at
Metres per second squared multiplied by seconds give metres per second, so the units agree. We converted to kilometres per hour by multiplying by 3.6.
The velocity graph is a straight line
The formula v = v0 + a · t looks the same as s = s0 + v · t, the formula for distance at a constant speed. It is a linear function y = m · x + b, only with time instead of x and velocity instead of y; the slope (gradient) is the acceleration and b is the initial velocity. The graph of velocity is therefore a straight line.
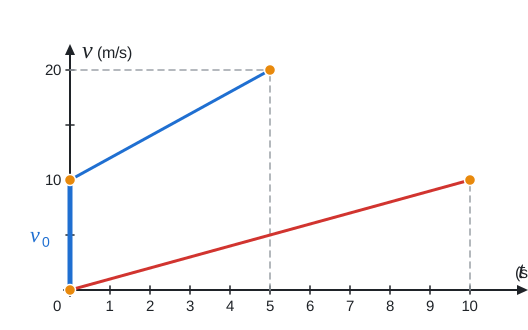
The red line belongs to the tram, it starts at the origin and rises by 1 m/s every second. The blue one belongs to a car crawling behind a tractor at 10 m/s, that is 36 km/h. The driver loses patience, puts his foot down and wants to overtake the tractor. The car now has an acceleration of 2 m/s2. Its graph starts on the vertical axis at a height of v0 = 10 m/s and rises twice as steeply as the tram’s graph. The slope of a velocity graph is the acceleration, just as the slope of a distance graph is the speed.
The distance is the area under the graph
How many metres does the car cover while overtaking? At a constant speed the distance is hidden in the area under the velocity graph. There the graph is horizontal and the area under it is a rectangle. Does it make sense for a graph that rises? We cut the time into thin strips, say a hundredth of a second each. In a hundredth of a second the velocity of the car changes by only 0.02 m/s, so in each strip the car travels at an almost constant speed and covers as much as the area of the strip, height times width. The thinner the strips, the more exactly this holds. When we add up the distances from all the strips, we get the whole area under the graph.
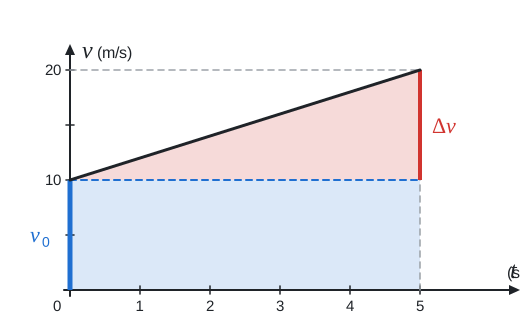
Under the velocity graph there is a trapezium. The horizontal dashed line cuts it into a blue rectangle and a red triangle. The blue rectangle is t wide and v0 high. Its area v0 · t corresponds to the distance the car would cover if it did not accelerate at all.
The red triangle is the reward for accelerating, the extra distance compared with driving at the original speed. It is right-angled: one of the two sides next to the right angle is the time t and the other is the increase in velocity Δv = a · t. Such a triangle is half of a rectangle with the same sides, so its area is
The rectangle and the triangle together give the distance in uniformly accelerated motion:
When an object starts from rest, the rectangle vanishes and only the triangle is left,
The seconds squared cancel and metres are left.
A simpler calculation suggests itself, s = v · t with the final velocity: 10 m/s · 10 s = 100 m. That is twice as much, because the tram travelled at 10 m/s only at the very end. In the graph we would be measuring the whole rectangle instead of the triangle, and its area is double.
Overtaking a tractor
Now let’s go through the whole overtaking step by step. The car accelerates for five seconds. How fast will it then be travelling and how many metres will it cover in the meantime? First the data:
The units are the base units and we already have the general formulas. First we substitute the numbers into the formula for velocity:
And into the formula for distance:
So the blue rectangle in the picture has an area of 50 m and the red triangle 25 m. Does the result make sense? If the car had travelled at the original 10 m/s the whole time, it would have covered 50 m, and if it had travelled at the final 20 m/s the whole time, it would have covered 100 m. The result lies between these two values. In five seconds the car accelerates to 72 km/h and covers 75 m.
Meanwhile the tractor carried on at 10 m/s and covered 50 m, the same as the blue rectangle. So in five seconds the car gained 25 m on the tractor, exactly the area of the red triangle. If the tractor were pulling a long trailer, the driver would have to keep accelerating for longer.
The average speed is exactly in the middle
We can also calculate the area of the trapezium in one go: the mean of the two parallel sides times the height. The parallel sides here are v0 and v, the height is the time:
But we can also write the distance as the average speed times the time,
The average speed lies exactly halfway between the initial and the final one. For the car it is 15 m/s, and 15 m/s · 5 s is again 75 m. This works only because the velocity graph is a straight line. Elsewhere the average speed need not lie in the middle, for example on the journey there at 60, back at 40.
Gaps in the ratio 1 : 3 : 5 : 7
When a car pulling away leaves a marker every second, the gaps grow in the ratio 1:3:5:7:9. In the velocity graph we can see this at a glance.
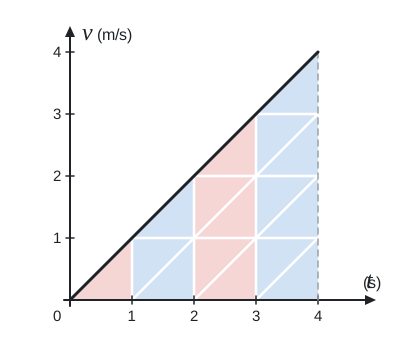
We have cut the area under the tram’s graph into strips one second wide, alternately red and blue. The area of each strip is the distance the tram covered during that second. The white lines divide the area into equal small triangles, each of which is half of a square of 1 s times 1 m/s. The first strip contains one small triangle, the second three, the third five and the fourth seven. Each further strip is one square taller, so it gains two small triangles. The distances covered in the individual seconds, and with them the gaps between the markers, are in the ratio 1:3:5:7.
When we add up the strips, we get the distance from the start: after one second one small triangle, after two 1 + 3 = 4, after three 1 + 3 + 5 = 9, after four 16. Every time we get the square of the number of seconds, exactly as in the formula
The distance graph is a parabola
We write down the distances covered by the tram,
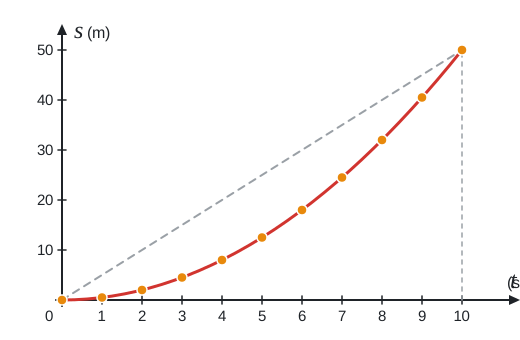
The points no longer lie on a straight line but on a curve called a parabola. Why does it bend upwards? The slope of a distance graph is the speed, and the tram’s speed keeps increasing. At the start the tram is standing still and the graph is horizontal, then it gets steeper and steeper. The grey dashed line is the graph of motion at a constant average speed of 5 m/s, which ends at the same point after ten seconds. The tram first lags behind, and towards the end it makes up the lost ground.
A mathematician would say that the distance is a quadratic function of time, because time appears in it squared. The graph of every quadratic function is a parabola, even for a car that does not start from rest. Its graph
Velocity without time
A tram gets up to 50 km/h in about fourteen seconds. How many metres does it cover in the process? We could calculate it via the time, but it can be done without it: there is a formula in which time does not appear at all. From the formula v = v0 + a · t we express the time,
In the numerator we expand the brackets and the middle terms cancel each other:
So we have
We check it on the car: (10 m/s)2 + 2 · 2 m/s2 · 75 m = 100 m2/s2 + 300 m2/s2 = 400 m2/s2, and that is indeed (20 m/s)2.
The tram starts from rest, so v2 = 2 · a · s and the distance is
To get up to 50 km/h the tram uses up almost a hundred metres of track.
The same formulas work for braking too, only with a negative acceleration when the positive direction points in the direction of travel. If a car brakes until it stops, the final velocity is zero and the relationship
How many metres a car really needs, once we add to the braking distance the moment before the driver even presses the brake, and why a car travelling at twice the speed needs a braking distance four times as long, we will work out in the next article, Braking and braking distance.
